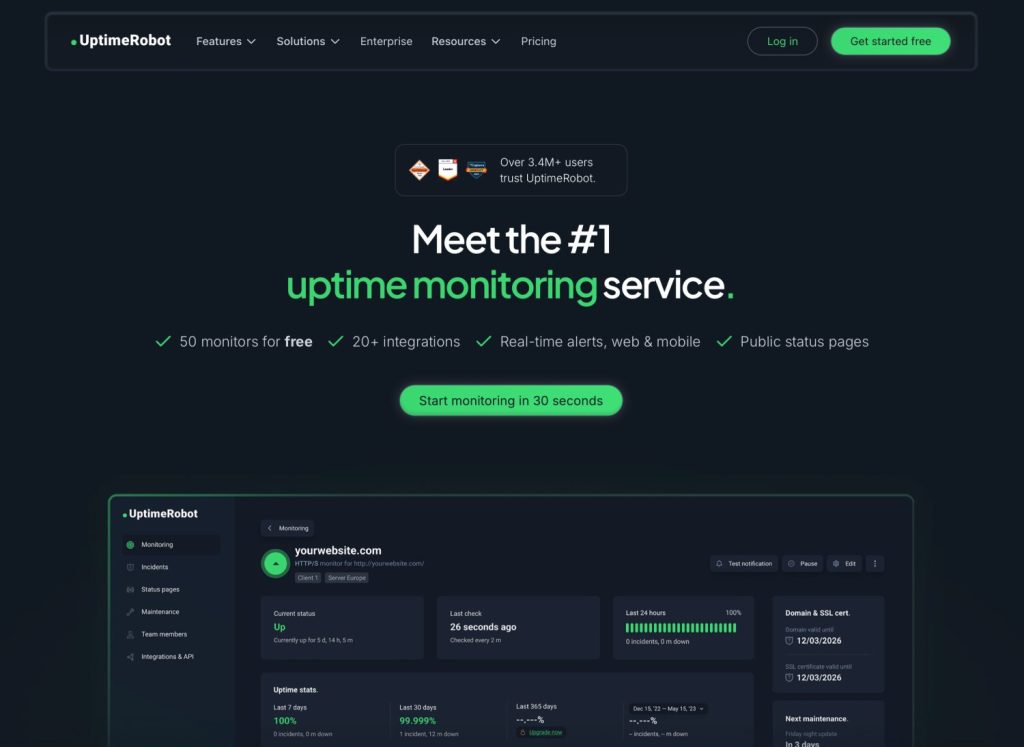
If you run websites, APIs, or any kind of online service, you know that sinking feeling when a client or user tells you something is down — before you even knew about it. That’s exactly the problem UptimeRobot was built to solve. I’ve been using it for many years, watching it evolve from a completely free tool into a more mature, feature-rich platform. In this review, I’ll walk you through everything you need to know: what it does, how well it works, what it costs, and whether it’s the right fit for your needs.

What Is UptimeRobot?

UptimeRobot is a cloud-based uptime monitoring service that checks whether your websites, servers, APIs, and other online endpoints are available and responding correctly. It pings your services at regular intervals and, the moment something goes wrong, sends you an alert via email, SMS, Slack, webhook, or a number of other integrations.
With over 3.4 million users trusting it globally, UptimeRobot has established itself as one of the most recognizable names in the monitoring space — and for a long time, it was also one of the most generous, offering a fully free plan to anyone who signed up.
A Bit of Personal History With UptimeRobot
I want to be upfront: I’ve been a long-time user of UptimeRobot, going back to the days when it was entirely free for everyone. Back then, it was genuinely one of those rare tools that asked for nothing and delivered enormous value. You could monitor dozens of sites, get instant email alerts, and sleep a little easier knowing something was watching your services while you weren’t.
Over the years, UptimeRobot evolved. It added more features, more integrations, and — inevitably — pricing tiers. The free plan is now reserved for non-profits and personal projects. For commercial use, you’ll need to pay. When that shift happened, I found myself building my own lightweight monitoring service (complete with SSL certificate detection) using Claude Code, because I needed something I could run on my own infrastructure without ongoing subscription costs. But I want to be clear: that’s a developer’s workaround, not something most people should need to do. For the vast majority of users — especially those who aren’t comfortable spinning up their own services — UptimeRobot remains an excellent, easy-to-use solution.
Nyckelfunktioner

UptimeRobot packs a surprisingly broad feature set, especially considering how accessible it is to non-technical users. Here’s what you get across all plans:
Uptime Monitoring Types
- Website & endpoint monitoring — The classic HTTP/HTTPS check. UptimeRobot sends a request to your URL and verifies it responds with the expected status code.
- Keyword monitoring — Checks that a specific word or phrase appears (or doesn’t appear) in the page response. Useful for catching broken deployments where the site returns a 200 OK but the content is wrong.
- Ping monitoring — Sends ICMP pings to a server to verify it’s reachable at the network level.
- Port monitoring — Checks that a specific TCP port on your server is open and accepting connections.
- Cron job monitoring — Verifies that scheduled tasks (cron jobs) are actually running on time.
- API monitoring — Tests API endpoints for correct responses.
- UDP monitoring — Checks UDP-based services.
Monitoring Features
- Multi-location monitoring — Checks from multiple geographic locations to distinguish between regional outages and global ones.
- Response time monitoring — Tracks how long your service takes to respond over time, with beautiful historical charts.
- SSL certificate monitoring — Alerts you before your SSL certificate expires (available on paid plans).
- Domain monitoring — Watches your domain expiry dates so you never accidentally let a domain lapse.
- DNS monitoring — Detects unexpected DNS record changes.
Alerting & Reporting
- Email alerts — Instant notification when a monitor goes down or recovers.
- Integrations — Over 20 integrations including Slack, PagerDuty, Zapier, webhooks, and more (some integration types are plan-dependent).
- Public status pages — Create a branded status page to keep your users informed during incidents.
- Incidents management — Log, track, and resolve incidents from within the dashboard.
The Dashboard Experience

The UptimeRobot dashboard is clean, dark-themed, and genuinely easy to navigate. At a glance, you can see the status of all your monitors — green for up, red for down, grey for paused. The right-hand sidebar gives you a quick summary: how many monitors are currently up, down, or paused, and your overall uptime percentage for the last 24 hours.
The main monitor list shows each monitor’s name, current status, how long it’s been in that state, check interval, and a small uptime bar chart covering recent history. It’s efficient — you can scan 40+ monitors in seconds and know exactly where to focus.
Clicking into an individual monitor takes you to a detailed view where you can see response time graphs, incident history, uptime statistics broken down by 7 days, 30 days, and 365 days, and region information. The interface has improved significantly over the years and feels polished without being over-engineered.
One of the monitors in my account is currently showing as down (a 404 error, down for 2 months and 29 days — clearly a deprecated endpoint I haven’t cleaned up yet). The fact that the dashboard makes this so visible is actually one of the things I appreciate: it’s hard to ignore problems when they’re flagged this clearly.
Individual Monitor Detail

The per-monitor detail page is where UptimeRobot really shines for day-to-day use. Here’s what you’ll find:
- Current status — Up or down, with how long it’s been in that state.
- Last check timestamp — So you know exactly how fresh the data is.
- Last 24 hours uptime bar — A visual green bar showing uptime across the day.
- Uptime statistics — Last 7 days, last 30 days, and last 365 days (with the annual figure locked behind paid plans).
- MTBF (Mean Time Between Failures) — Useful for understanding how reliable a service is over time.
- Response time chart — A live-updating graph showing average, minimum, and maximum response times. In my case, one monitor is averaging around 740ms with a max of 781ms.
- Domain & SSL certificate expiry — Visible on paid plans, showing when your domain and SSL cert expire.
- Regions — Which geographic locations are performing the checks.
- Maintenance windows — Schedule planned downtime so you don’t get false alarms during deployments.
The response time graph is particularly useful for diagnosing intermittent performance issues. If your site doesn’t go fully down but periodically slows to a crawl, this data will show it clearly.
Pricing: What You’ll Actually Pay

This is where things have changed most significantly from UptimeRobot’s early days. Here’s the current pricing structure (annual billing, which saves approximately 15% over monthly):
Gratisplan
The free plan is now specifically for non-profits and personal projects. It includes:
- Up to 50 monitors
- 5-minute monitoring intervals
- Email alerts
- Public status pages
- Basic integrations
If you genuinely qualify for the free plan, it’s an exceptional deal. 50 monitors with 5-minute checks is more than enough for most personal projects or small non-profit websites.
Solo — €9/month
- 10 monitors (scalable)
- +1 Third party service monitor
- 60-second monitoring intervals
- All monitor types including SSL & DNS
- 3 status pages with custom domain
- 12-month data retention
The Solo plan is aimed at freelancers and small site owners. The jump from 5-minute to 60-second checking intervals is significant — you’ll catch outages much faster.
Team — €35/month (Most Popular)
- 100 monitors
- +20 Third party service monitors
- 30-second monitoring intervals
- 3 seats included
- 100 status pages, white-label
- Webhook, Zapier & PagerDuty integrations
The Team plan is the sweet spot for small agencies or development teams running production services. The 30-second interval means you’re never more than half a minute away from knowing about a problem.
Scale — €65/month
- 200 monitors (scalable to 500)
- +40 Third party service monitors
- 15-second monitoring intervals
- 5 seats included
- Unlimited status pages
Enterprise — Custom pricing
- Any amount of monitors you need
- Custom & faster monitoring intervals
- Dedicated Customer Success Manager + private Slack
- SOC 2, DPA, MSA & security review
- SLA + white-glove onboarding
- Custom invoicing
What UptimeRobot Does Particularly Well
Ease of Setup
Adding a new monitor takes about 30 seconds. You paste in a URL, choose your check interval, select your notification contacts, and you’re done. There’s no complex configuration, no YAML files, no server setup. This is genuinely one of the easiest monitoring tools to get started with, which is why it’s so popular with non-developers.
Reliability
In my years of using UptimeRobot, I’ve found its monitoring to be consistently reliable. The checks happen when they’re supposed to, the alerts arrive promptly, and false positives are rare. That’s ultimately the most important thing you can say about a monitoring service.
The Free Tier (For Those Who Qualify)
If you’re running a personal project or a non-profit, 50 monitors with 5-minute checks and email alerts is genuinely generous. Most personal projects don’t need sub-minute monitoring — knowing within 5 minutes that something is down is more than sufficient.
Status Pages
UptimeRobot’s public status pages are clean, professional, and easy to set up. Being able to point users to a status page during an incident is enormously helpful for managing communication and reducing support tickets. White-label status pages (on Team and above) let you host them on your own domain.
Third-Party Service Monitoring
The third-party monitors feature is relatively new and genuinely useful. You can monitor services like Cloudflare, AWS, and Microsoft 365 to see if problems with your site might actually be caused by upstream providers rather than your own infrastructure. This kind of context is invaluable when debugging incidents. Speaking of Cloudflare, if you’re managing security settings there, you might also want to check out how to use a passkey on Cloudflare instead of an authenticator app for better account security.
What UptimeRobot Doesn’t Do as Well
The Shift Away From Universal Free Access
The biggest complaint most long-time users have is the removal of universal free access for commercial use. I understand the business reasoning — running a monitoring infrastructure at scale costs real money — but it does represent a meaningful shift from what made UptimeRobot special in the first place. For commercial projects, you’ll need to pay, and that’s a legitimate consideration when comparing it to alternatives.
SSL and Domain Monitoring on Free Plans
SSL certificate expiry monitoring is locked to paid plans. This is arguably one of the most practically important alerting features — an expired SSL certificate will take your site down just as surely as a server crash — and it would be nice to see it available on the free tier. When I decided to build my own monitoring setup, SSL detection was actually the feature I was most determined to include.
Annual Data Retention Locked to Paid Plans
The free tier doesn’t retain data for 12 months, which limits your ability to do long-term trend analysis. If you want to understand seasonal patterns in your uptime or response times, you’ll need at least the Solo plan.
How UptimeRobot Compares to Self-Hosted Alternatives
If you’re a developer comfortable with setting up your own infrastructure, there are self-hosted alternatives worth knowing about — tools like Uptime Kuma, for instance, can be run on your own server for free. I ended up building my own lightweight monitoring script with SSL detection using Claude Code, and I’ve been happy with it for my personal infrastructure needs.
However, self-hosting comes with its own overhead: you need to maintain the server, keep the software updated, make sure the monitoring service itself doesn’t go down, and handle your own alerting pipeline. For most people — and for any team environment — the convenience, reliability, and professional features of UptimeRobot far outweigh the cost of a subscription. A few euros or dollars per month is trivially cheap compared to the cost of extended downtime.
If you’re looking at other tools in the developer services space, you might also find our review of Claude Code Pro Plan useful, especially if you’re considering building any custom tooling of your own.
Who Should Use UptimeRobot?
Personal Projects and Non-Profits
If you qualify for the free plan, this is a no-brainer. Sign up, add your sites, set up email alerts, and forget about it. The 5-minute check interval is perfectly adequate, and 50 monitors is more than enough for most personal setups.
Freelancers and Small Agencies
The Solo or Team plan makes a lot of sense here. If you’re managing sites for clients, having a reliable monitoring service lets you catch and fix problems proactively — often before the client even notices. That kind of responsiveness builds trust and justifies your retainer fees. The cost is easily recoverable in a single avoided client complaint.
Small to Medium Development Teams
The Team plan at €35/month is excellent value for a team running production services. 100 monitors, 30-second intervals, PagerDuty integration, and white-label status pages cover everything most small engineering teams need.
Enterprise and High-Volume Use Cases
For large organizations with compliance requirements, the Enterprise plan’s SOC 2 documentation, dedicated CSM, and SLA guarantees make UptimeRobot a credible choice even in regulated environments.
Who Might Look Elsewhere
If you’re a developer who wants full control, can manage your own infrastructure, and doesn’t want a recurring subscription, a self-hosted solution might suit you better. Similarly, if your primary need is APM (Application Performance Monitoring) with code-level tracing and distributed tracing, UptimeRobot isn’t trying to be that tool — you’d want something like Datadog or New Relic instead.
Quick Summary: Pros and Cons
Proffs
- Extremely easy to set up and use
- Generous free plan for personal projects and non-profits (50 monitors)
- Wide variety of monitor types (HTTP, keyword, ping, port, cron, API, UDP)
- Clean, well-designed dashboard
- Multi-location monitoring helps identify regional issues
- Third-party service monitoring for upstream providers
- Good status page functionality
- 20+ integrations including Slack, PagerDuty, and Zapier
- Long-standing, reliable service with millions of users
Nackdelar
- Commercial use requires a paid plan (no longer universally free)
- SSL and domain monitoring locked to paid tiers
- Annual data retention only on paid plans
- Domain and SSL monitoring unavailable on the free tier
- Not a replacement for full APM or distributed tracing tools
Conclusion: Still One of the Best in Its Class
After all these years, UptimeRobot remains one of the best uptime monitoring services available. It’s not the cheapest option if you’re paying for it commercially, and I’ll be honest that the shift away from universal free access was disappointing. But it’s easy to use, genuinely reliable, packed with useful features, and reasonably priced for what it delivers.
If you qualify for the free plan — non-profit or personal project — sign up immediately. There’s genuinely no reason not to. If you’re a freelancer or small agency, the Solo or Team plan will quickly pay for itself the first time you catch an outage before your client does. And if you’re a developer who wants to build your own solution, that’s a valid path too — though be prepared to invest real time in making it robust.
For most people who want easy, reliable, “set it and forget it” monitoring without needing to manage any infrastructure, UptimeRobot is the answer. It earned its reputation over many years, and it continues to deserve it.
And if you’re thinking more broadly about the tools and services you use to manage your online presence, you might also find it worthwhile to think about where your domains are registered — check out our guide to the cheapest .co.uk domain registrars to make sure you’re not overpaying there either.
Senast uppdaterad 15 oktober 2026
 Svenska
  English
  Deutsch
  Nederlands
  Français
  Español
  Italiano